Getting started with Google Analytics

Google Analytics is a must-have for any website these days. In fact, we add it to every website we create free of charge. Once you know the basics of how it works (which I’m sure you will after reading this) it can be a super useful tool that can really impact how you think of your online presence.
Gaining access
One thing to note is that you’ll need to be using a Google account in order to gain access to Google Analytics. This can be either a G Suite account or free Gmail account. Once you’ve got one of those, we can grant you access to your website’s Google Analytics data and get you up and running.
To view your analytics account go to analytics.google.com. If you have multiple websites all with Google Analytics you may need to select your preferred one with a button in the top-left hand corner. It’ll probably say ‘All website data’ on it.
Right. I’m in. What’s going on?
So once you’re in you’ll probably be interested in three main areas of Google Analytics. These three areas can be accessed in the left-hand menu and are labelled Audience, Aquisition, and Behaviour. Let’s take a look at each of them in turn.
Audience
Translation: Who are these people visiting my website?
If you’re wondering what sort of people are visiting your website then this is the section you need. You can find out about where they are in the world, the device they were using when accessing your site, even anonymised demographic data. You’ll also find all these different metrics in the left-hand menu:
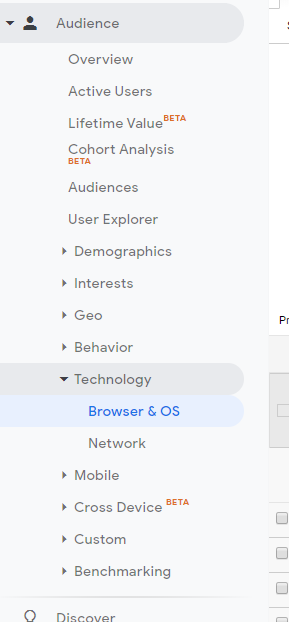
As an example, we’re going to look at the Browser and OS our lovely visitors were using when they visited the site. Clicking on that link will show two main things on the page – a table of data and a line chart. This table and chart pop up a lot. Another thing that’s on most of our useful pages is the date selector in the top-right hand corner:
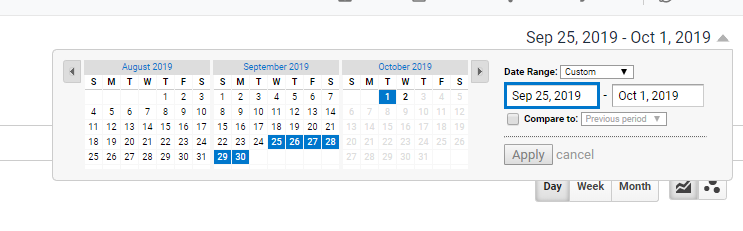
Clicking on that allows you to change the date range of the data presented in the table and chart.
If you click on one of the data points in the table you’ll be able to drill down into that data and get more information. For example, I can see in my table that Google Chrome is the most popular browser that visitors use:
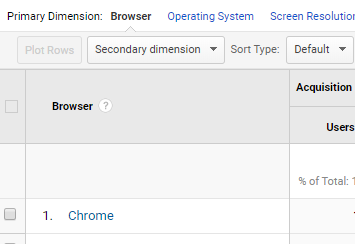
If I click on Chrome it’ll give me the versions of that browser that people were using. This deeper layer of info can be pretty useful when looking at any metric, so it’s worth giving it a click.
Google Analytics 4 update:
In the newest version of Google Analytics, you’ll see that Audience has now been replaced by a ‘user’ section, which in turn is split into Demographics and Tech. You can still get hold of the same information from either of these, but watch out for those new labels. To be honest, we think the new labels make way more sense, but remember you can find the exact same data even if you’re running an older version of Google Analytics.
Aquisition
Translation: how did these people arrive on my website?
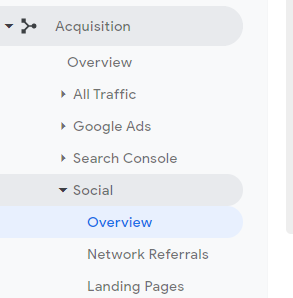
This tells us how people came to your site. This could be directly (ie typing your website URL directly in their browser) through a Google Search, a social media link, or by clicking on one of your online ads.
Our table, chart, and data range selector from the Audience section is all still available here, as is drilling down into the data to get more detail (or a data-detail-drill-down. Nice)
Click around in the left-hand menu, and if in doubt, click the ‘Overview’ item. It’s always a good place to start.
Behaviour
Translation: what do these people do once they’re on my website?
In this section, we can answer questions such as ‘how long do people spend on my site’ and ‘what are the most popular pages on my site’?
By this point, you’re hopefully thinking that there are a few standards across Google Analytics that apply to all metrics. So all the fan favourites are here too: table, chart, date selector, data-detail-drill-down, Overview pages. Check out the ‘behaviour flow’ section here too, it’s pretty cool. It shows the ‘journeys’ that visitors took through your site. For example, seeing how many people started on the home page, then the portfolio page, then a case study, followed by the contact page. It can be super useful.
Google Analytics 4 update:
In GA4 you’ll see this information in the ‘Engagement’ area. This is because the new version measures a bunch of new engagement metrics, such as scrolls, clicks, and a new ‘user engagement metric. This last one replaces the ‘bounce rate’ metric. Essentially it measures how many users are engaged with the site. To be marked as engaged, a user needs to:
- Actively engaged with your website or app in the foreground for at least 10 seconds
- Fire a conversion event
- Fire 2 or more screen or page views
This is super useful and more thorough than the old ‘bounce rate’ metric.
Wrap up
There’s quite a bit more in Google Analytics, but as the title proudly states, we are just getting started here. This should give you enough to get going, but if you have any comments or questions do just let us know – we’ll be happy to help.

Google PageSpeed Insights: totally pointless or well worth pursuing?

In search of HTML email building that is easy AND effective

Marginal gains: the small efficiencies in web design that will have a big impact

The quick fix for your web image sizing woes